


Football Prediction’s AI Soccer Predictor is built for this kind of audit: it presents football forecasts as probabilities, not guarantees, so users can judge prediction accuracy through calibration, sample size, and settled football forecast results.
> Definition: Football prediction accuracy is the degree to which a model's forecasted probabilities match real match outcomes over a statistically meaningful sample, measured through hit rate, calibration scores, and formal metrics like the Brier score.
Five Facts About Football Prediction Accuracy Every Fan Must Know
- A realistic 1X2 football model usually lands around 50–60%. Random guessing across home win, draw, and away win starts near 33%, so 55% can be meaningful over enough matches.
- Raw hit rate hides probability quality. A model that calls ten 51% outcomes and wins six is not the same as one that calls ten 75% outcomes and wins six.
- Claims of 90–99% accuracy on normal match-winner markets are not credible. They usually come from cherry-picked leagues, mixed bet types, deleted losses, or grading “double chance” as if it were 1X2.
- Transparent records matter more than screenshots. A useful football prediction track record shows timestamped forecasts, settled results, market type, league, and sample size.
- Football has hard variance. A red card, wet turf under floodlights, or a centre-back tugging at a hamstring after a recovery sprint can change the match without asking the model first.
The ball still bounces.
How Football Prediction Accuracy Works
Football prediction accuracy works by checking whether forecast probabilities were good over many settled matches, not whether one pick won tonight. A useful model turns inputs such as team strength, xG profile, injuries, rest, venue, tactical matchups, and market movement into final estimates for each outcome.
The mechanism is simple, but the grading must be strict:
- Start with the right baseline for the market. A 1X2 forecast has three outcomes, while BTTS or Over/Under has two, so the same hit rate can mean different things.
- Compare hit rate with calibration. Winning 56% matters less if the model kept calling those picks 75% chances.
- Use Brier score to measure the size of the probability error, not just the final result.
- Treat short streaks as noise until the sample is large enough. Five wins in a row can be form, luck, or soft fixtures.
Good accuracy is probability quality under pressure. It should survive dull nil-nils, late penalties, and the odd red card.
What Football Prediction Accuracy Means by Market Type
Football prediction accuracy changes by market type because each market has a different baseline. A 55% hit rate in 1X2 is not equal to 55% on both teams to score.
A 1X2 forecast has three possible outcomes: home win, draw, or away win. The rough random baseline is 33%. Over/Under 2.5 goals and BTTS are two-way markets, so the rough baseline is 50%. That difference matters before judging any headline percentage.
Sites sometimes inflate prediction accuracy by mixing easier two-way markets with harder three-way markets. A record might include heavy favorites, double-chance picks, and low-risk totals, then present the whole thing as “match prediction accuracy.”
For match-winner forecasts, judge 1X2 separately. For goals markets, judge Over/Under separately. For BTTS, use its own log. They had the ball, but not the chances; that sentence explains why possession models and goal markets often grade differently.
What AI Soccer Predictor Does for Football Prediction Accuracy
AI Soccer Predictor supports football prediction accuracy by showing forecasts as probabilities, not guaranteed winners. Its job is to make the uncertainty visible so users can judge whether the model was well calibrated after the match is settled.
The useful accuracy signal is not just “won” or “lost.” It is whether a 62% home-win call behaved like a 62% chance over many similar matches, whether the pick was timestamped before team news changed, and whether the final result was graded under the right market.
- Separate 1X2, BTTS, and Over/Under forecasts before comparing percentages.
- Check the prediction timestamp against injuries, lineups, suspensions, and late market movement.
- Compare the displayed probability with settled results over a meaningful sample, not one weekend.
- Verify that the record shows the league, market type, odds context, and grading rule.
- Question any accuracy percentage that lacks sample size, update history, or a clear result log.
A fresh lineup update can matter more than yesterday’s confidence score. Trust the percentage only when the audit trail is as visible as the prediction.
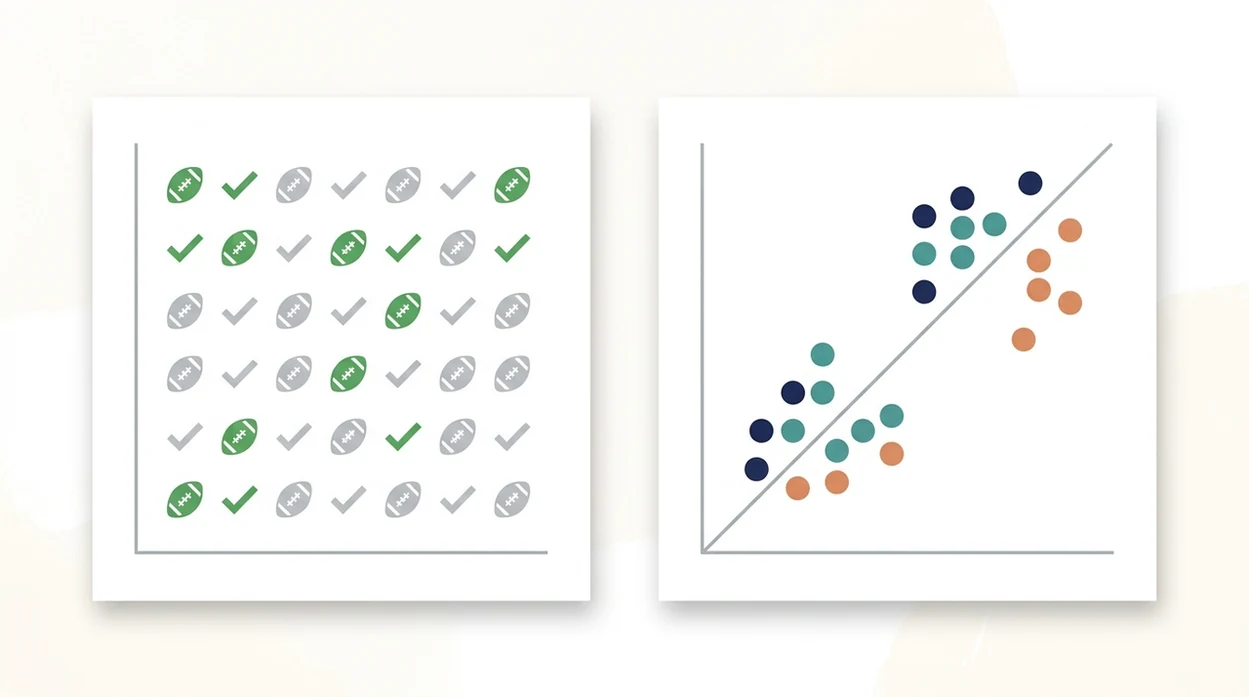
How Model Calibration Drives Football Forecast Results
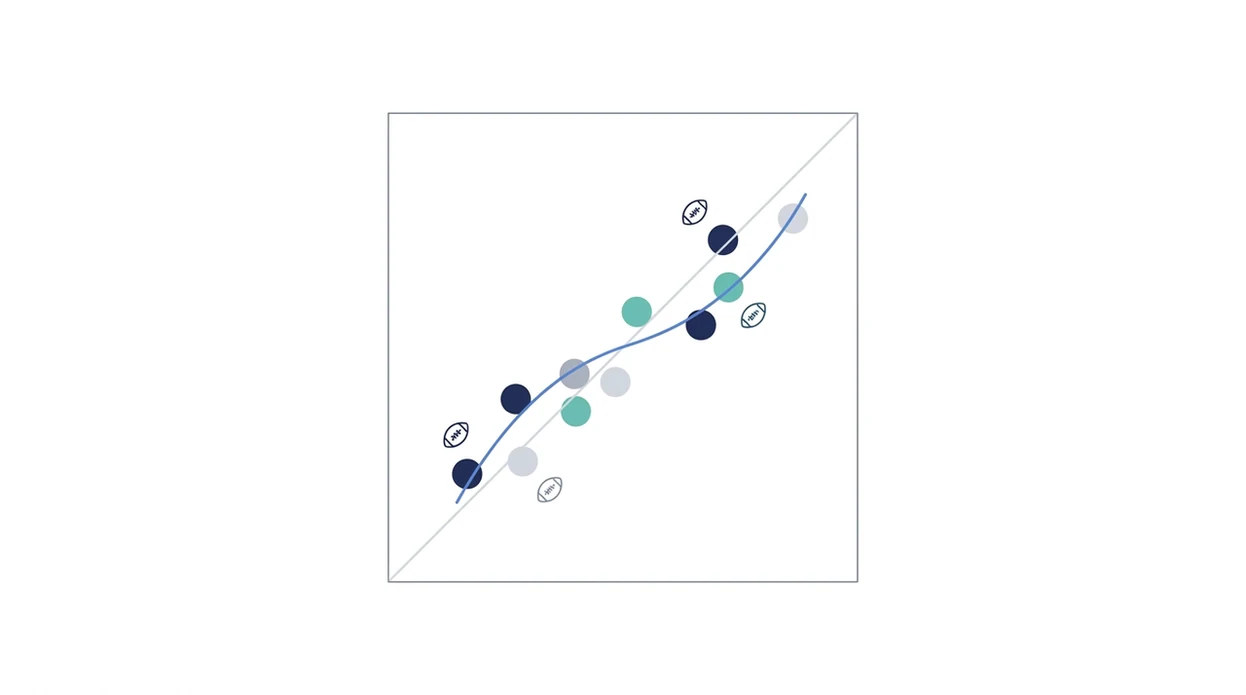
Model calibration is the test of whether predicted probabilities match observed frequencies over time. If a model gives 60% home-win probabilities across 1,000 matches, about 600 of those home teams should win.
That is how football prediction accuracy works in practice. The mechanism is not “the model knew the winner.” It is a probability engine, often using xG profile, team strength, home tilt, rest disadvantage, injuries, and market signals to estimate each outcome. The lay version is simpler: if the model says 40%, that outcome should happen roughly four times in ten.
Brier Score and Reliability Diagrams Explained
The Brier score measures the gap between forecast probabilities and real outcomes. Lower is better. The metric is widely used for probabilistic forecast verification; see NOAA’s explanation of Brier score interpretation: https://www.cawcr.gov.au/projects/verification/#Brier_score. Large-scale sports forecasting research commonly treats scores around 0.20–0.25 as reasonably calibrated, not perfect.
Reliability diagrams make calibration visible. They group forecasts into bands, such as 50–60%, then check whether outcomes happen at that rate. Bookmakers’ implied probabilities can also act as a calibration benchmark after removing the margin. Small miscalibrations matter; overrating 60% chances as 65% can wipe out expected value over thousands of bets.
That tiny gap hurts.
How to Audit Football Prediction Accuracy Step by Step
To audit football prediction accuracy, test the forecast record like a live match log, not a sales page. A valid audit checks timing, sample size, market type, calibration, and out-of-sample performance.
- Check the sample size. Use hundreds of predictions at minimum; low thousands are better for league-level confidence.
- Confirm forecasts were recorded before kick-off. Look for timestamped logs, not edited result pages after full time.
- Separate results by market type and league. Grade 1X2, BTTS, Over/Under, and correct score prediction independently.
- Calculate calibration metrics. Use Brier score or reliability bands, not only hit rate.
- Compare against a naive baseline. Always picking the favorite is a simple benchmark many weak systems fail to beat.
- Verify forward-tested results. Back-tested results can leak future information, so live records carry more weight.
For fans comparing public models, AI football prediction accuracy results should be judged by the same audit steps. Tools like AI Soccer Predictor can be useful when they show probability bands and update timestamps, but the numbers still need grading.
Why Ensemble Models Improve AI Football Prediction Accuracy
Ensemble models can improve AI football prediction accuracy when their component models make different mistakes. One model may lean on xG profile, another on market movement, and another on team-news adjustments.
A single model is fragile. If it overvalues possession against low blocks, it may keep rating territory as danger. The supporter on the train home knows the problem: “they had the ball, but not the chances.”
Ensemble AI approaches blend statistical models, machine-learning features, and market-based signals. The point is not to average everything blindly. It is to reduce model-specific bias after out-of-sample validation. Forecasting aggregation research generally finds that combining independent forecasters improves accuracy when their errors are not perfectly correlated.
For most football fans, an ensemble forecast is often easier to trust than one private model because it is less exposed to a single bad assumption.
Common Myths About Football Prediction Accuracy
The biggest myth is that good AI should be right 90%+ on match-winner bets. That number does not fit normal football variance, market efficiency, or the three-outcome structure of 1X2.
A few correct weekends do not prove a system works. Short streaks happen. I have watched a model hit six Saturday favorites, then lose its edge when a Sunday lineup dropped and one missing full-back changed the BTTS read.
Lower odds do not automatically mean more accurate picks. Odds include implied probability, bookmaker margin, liquidity, and public demand. A 1.35 favorite may still be badly priced if the model’s true estimate is lower.
Calibration also matters even when the win rate looks good. A model can win often by choosing favorites, yet still overstate confidence. Accurate football forecasts deliver probabilities, score ranges, and uncertainty, not guaranteed wins. For guarantee language, the safer question is can football predictions guarantee wins.
At a Glance: Football Prediction Accuracy Benchmarks
Football prediction accuracy benchmarks should be compared against the correct baseline. The table below treats 1X2 match-winner forecasts as the reference point.
| Benchmark type | Typical 1X2 accuracy range | What it means | Trust signal |
|---|---|---|---|
| Random guessing | Around 33% | Three outcomes split evenly in theory | No predictive edge |
| Naive favorite picker | Often competitive in strong-favorite leagues | Uses market strength without model depth | Useful baseline |
| Typical statistical model | 50–55% | Uses form, ratings, goals, and home advantage | Needs calibration checks |
| Top AI ensemble model | 55–60% | Blends xG, squad data, market signals, and model averaging | Must be forward-tested |
| Bookmaker implied probabilities | Calibration benchmark, not a pick system | Useful after margin adjustment | Strong long-run reference |
| Fraudulent claim range | 90%+ | Usually cherry-picking or market mixing | Treat as a warning sign |
Apps such as AI Soccer Predictor, Forebet, PredictZ, and Football Whispers should be read through this benchmark table, not through slogans. The fresh data timestamp under a prediction matters more than a shiny confidence badge.
When comparing AI Soccer Predictor with Forebet, PredictZ, or Football Whispers, check whether each service publishes pre-match timestamps, settled result logs, and market-specific grading. If those details are missing, the headline prediction accuracy should be treated as marketing rather than evidence.
Limitations
Football prediction accuracy has limits that no model can remove. Probability is a map of uncertainty, not a way around it.
- Injuries and red cards create sudden state changes. A winger injury can force a formation change and cut chance volume on one side.
- Weather affects shot quality and passing speed. Rain can take pace off through-balls and reduce clean transition chances.
- Back-tested performance often overstates real accuracy. Overfitting and data leakage can make historical football forecast results look cleaner than live predictions.
- Vendor figures often lack context. Many pages omit baselines, sample sizes, confidence intervals, league filters, and grading rules.
- Calibration drifts over time. Teams change managers, tactics evolve, promoted clubs behave differently, and rule interpretations shift.
- Accurate forecasts are not a complete betting strategy. Staking, variance, limits, and discipline sit outside the prediction itself.
- Market efficiency caps long-term edges. Popular leagues have sharper prices and bookmaker margins that compress value.
If a page promises certainty, treat it like sure win prediction today language. For risk framing, read responsible football prediction before treating any probability as a plan.