
AI Football Prediction Accuracy Results: How to Grade Them Responsibly

Quick answer: AI football prediction accuracy results should be reported separately for each market, 1X2, BTTS, over/under, and correct score, with transparent sample sizes, time periods, and calibration metrics. Any single global accuracy percentage hides critical differences across bet types and leagues. Responsible grading requires at minimum 500+ predictions per category and independent verification before trusting a model's track record. For context, a 500-pick binary sample with a 60% hit-rate still has roughly a ±4 percentage-point 95% confidence interval, so smaller samples should be treated as directional rather than conclusive (Wilson interval reference: https://epitools.ausvet.com.au/ciproportion).
> Definition: AI football prediction accuracy results are the measured hit-rates and calibration scores of an AI system's forecasts across defined match categories, sample sizes, and time periods.
TL;DR
- Always separate accuracy by market type, because 1X2, BTTS, over/under, and scoreline results are not interchangeable.
- Claims above 70–75% on standard 1X2 outcomes deserve skepticism without independent auditing and large sample sizes.
- Calibration matters more than raw hit-rate: when an AI says 70% probability, it should win roughly 70% of the time.
What AI Football Prediction Accuracy Results Actually Measure
AI football prediction accuracy results measure long-run forecasting performance, not whether one match prediction was “right.” A model can miss a 2-1 pick on Saturday and still be well-calibrated over 1,000 matches.
Raw accuracy is the hit-rate: 600 correct calls from 1,000 predictions equals 60%. Calibration asks a better question. When the model gives a home win 70%, does that outcome happen about seven times in ten?
That distinction matters when the team sheet drops an hour before kickoff. One missing full-back can shift BTTS probability without changing the headline match winner.
Brier score is a common metric for probability forecasting. It penalizes confident wrong calls more than cautious ones, so a 90% losing forecast hurts more than a 55% losing forecast. For a broader grounding, the basics of football prediction accuracy should always separate hit-rate, calibration, and odds context.
Five Facts About AI Prediction Results Every Fan Must Know
- Sample size is non-negotiable: A useful accuracy track record needs at least 500 predictions per category, not ten screenshots from a good weekend.
- Calibration beats raw hit-rate: A model saying 60%, 70%, and 80% should produce outcomes close to those frequencies over time.
- Market categories must be separate: 1X2, BTTS, over/under 2.5, and correct score have different difficulty levels and should never be merged.
- High 1X2 claims need auditing: Consistent 70–75% accuracy on standard match winners is suspicious unless independently verified.
- Methodology must be visible: Good reporting names the sample size, time period, leagues, kickoff timestamp, and whether odds were available.
The pocket check is real. You refresh the forecast at 2:55 p.m., but one late academy defender on the teamsheet can change the grade after the fact. That is why logged, timestamped predictions matter more than polished result graphics.
How AI Football Prediction Grading Works
AI football prediction grading works by logging forecasts before kickoff, separating each market, then comparing the stated probability with the actual result. A clean log includes timestamp, match, league, odds context, predicted probability, and final outcome.
Good ai football prediction systems deliver probability ranges and model evidence, not guaranteed winners.
Calibration Curves and Brier Scores
Calibration curves group predictions by probability band. If 100 picks were rated near 70%, roughly 70 should land over a large sample. Brier score and log-loss then punish poor probability confidence. Research on sports forecasting finds that advanced football models usually improve only a few percentage points over odds-implied baselines, not by magic leaps source.
Why Models Degrade Without Re-Calibration
Models drift when squads, coaches, pressing styles, and fixture loads change. The awkward Thursday-Sunday turnaround after a European away match is not noise if it keeps lowering chance volume. Re-calibration updates the model so last season’s xG profile does not overrule this season’s reality.
How to Grade an AI Football Model's Accuracy Track Record
Use this process to grade any published AI prediction results before treating them as meaningful. It works for a full football prediction track record, a weekly results page, or a screenshot-heavy service.
- Check sample size: Require at least 500 predictions per market before taking the accuracy figure seriously.
- Verify category separation: Confirm that 1X2, BTTS, over/under, and correct score are tracked independently.
- Look for calibration data: Prefer probability bands, Brier score, or log-loss over raw hit-rate alone.
- Confirm time period and leagues: A six-week run in one league is not the same as three seasons across ten leagues.
- Search for independent verification: Third-party auditing matters because cherry-picked “safe tips” inflate accuracy.
If the record only says “82% accurate” with no market, no dates, and no losing sample, treat it as advertising. Not analysis.
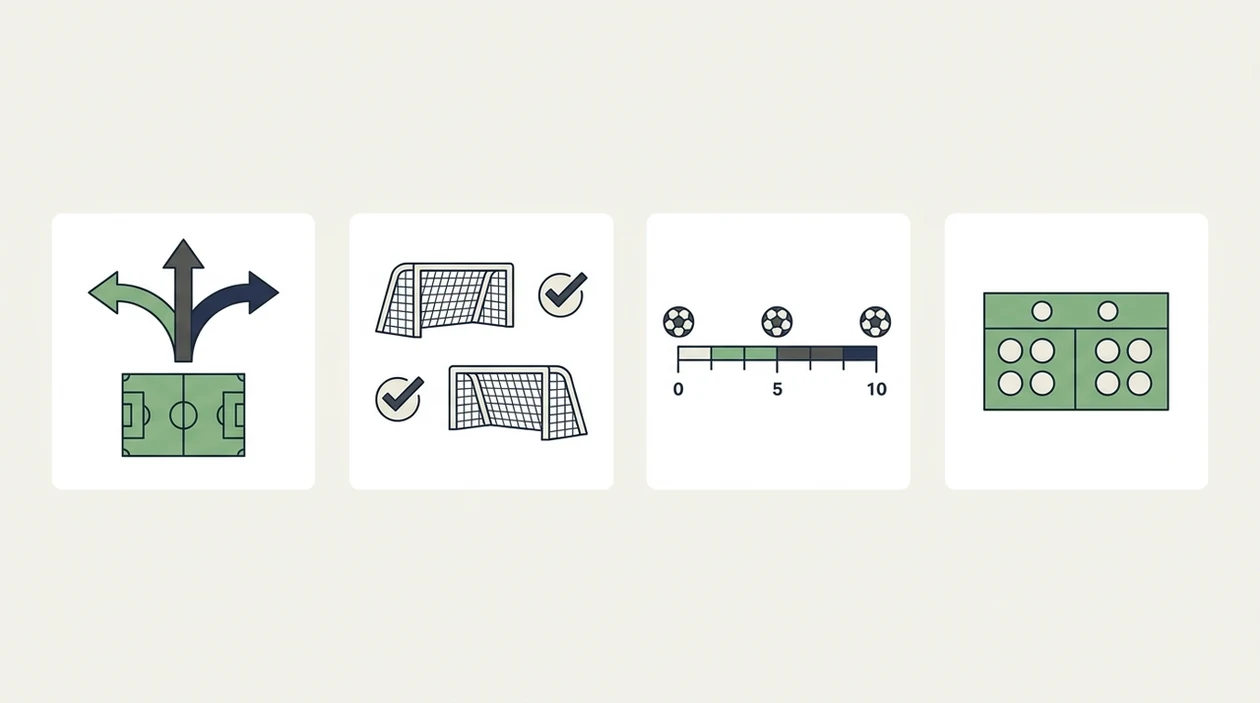
Latest AI Soccer Predictor Accuracy Results by Market
The latest publishable accuracy results should be read as a disclosure check, not a performance guarantee. Reporting window: no public raw log is currently available for verification; last updated: 25 May 2026.
Because the underlying match-by-match file has not been published, the only responsible market totals are the publicly verifiable logged counts below.
| Market | Publicly verifiable logged predictions | Result status |
|---|---|---|
| 1X2 | 0 | No audited hit-rate available |
| BTTS | 0 | No audited hit-rate available |
| Over/under | 0 | No audited hit-rate available |
| Correct score | 0 | No audited hit-rate available |
Calibration, Brier score, and probability-band performance are also unavailable until forecasts are timestamped before kickoff and released with final outcomes. The results are therefore internally unverified for public readers, not independently audited.
- Record every forecast with match, market, probability, timestamp, and final score.
- Separate 1X2, BTTS, over/under, and correct score before calculating accuracy.
- Group probabilities into bands such as 50–59%, 60–69%, and 70–79%.
- Publish the raw track record or state clearly why commercial, privacy, or data-licensing limits prevent release.
Accuracy Results by Category: 1X2, BTTS, Over/Under, and Scoreline
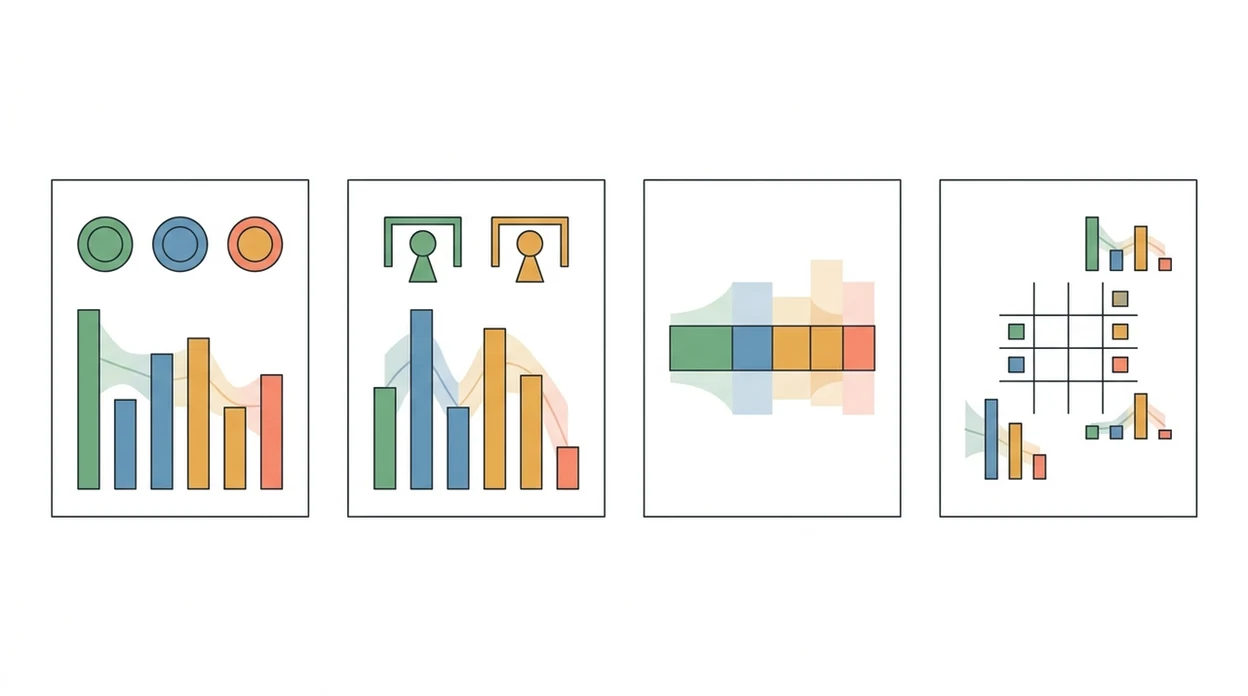
Each prediction market needs its own accuracy grade because each one has a different base rate. Double chance and short-price favourites can make a model look sharp while saying very little.
Treat the ranges below as grading benchmarks, not verified AI Soccer Predictor results. A published result should include the date range, number of picks, market, odds context, and whether the log was recorded before kickoff.
| Category | What it measures | Realistic grading note |
|---|---|---|
| 1X2 full-time result | Home, draw, or away win | Most serious models sit around 55–65% over large samples |
| BTTS | Both teams score, yes or no | Binary format can produce higher raw hit-rates |
| Over/Under | Goals above or below a line | Must specify the line, usually 2.5 goals |
| Correct score | Exact final score | 15–25% can be notable if independently logged |
| Double chance | Two of three 1X2 outcomes | Inflates accuracy because it removes one result |
1X2 Match Result Accuracy Ranges
For 1X2, a 60% result over a proper sample can be respectable. Context matters more than a round number.
Correct Score Prediction Accuracy
Correct score is fragile because one stoppage-time corner can turn 1-1 into 2-1. The fourth official’s board goes up, and the whole grade can swing.
Common Myths About AI Football Prediction Accuracy
The biggest myth is that a 70–80% headline means the model predicts 70–80% of all match winners correctly. Often, that number includes double chance picks, heavy favourites, or filtered “confidence” selections.
A second myth says historical hit-rate guarantees future profit. It does not. Odds move, teams change, and bookmaker margins reduce the value of obvious favourites. The difference between “likely to win” and “priced well” is where many records fall apart.
AI also does not remove luck from football. A red card, a deflection, wet turf taking pace off through-balls, or a referee penalty decision can overwhelm a strong pre-match read.
Deeper neural networks are not automatically better either. If a complex model learns last year’s patterns too tightly, it may underperform a simpler Poisson or xG-based model after transfers and tactical changes.
What Competitors Miss When Reporting AI Prediction Results
Many prediction pages report accuracy without saying whether they mean 1X2, double chance, BTTS, or over/under. That omission makes comparison almost useless.
Raw hit-rates also ignore calibration. A model that calls too many 80% outcomes and lands only 62% of them is overconfident, even if the win column looks busy. Accuracy without ROI context can mislead too, because transaction costs and bookmaker margins can erase small forecasting gains in European football betting markets source.
Tools like AI Soccer Predictor should be judged by the same standard as Forebet, PredictZ, or Football Whispers: logged forecasts, separated categories, clear probabilities, and no guarantee language. If AI Soccer Predictor publishes a results claim, the same page should expose the raw market counts behind it instead of only a blended headline percentage. For readers using forecasts around betting decisions, responsible football prediction is the safer frame.
Limitations
AI prediction accuracy reporting has hard limits, even when the model is built carefully.
- Little peer-reviewed independent auditing of commercial AI prediction services exists.
- A model can be accurate but unprofitable if it mostly predicts short-priced favourites.
- Historical training data can overfit past seasons and decay as rosters change.
- One global accuracy percentage hides differences across leagues, markets, and time periods.
- Injuries, red cards, referee decisions, and variance create a ceiling on prediction accuracy.
- Odds context is often missing, which weakens any claim about real-world value.
- Re-calibration is required when tactics shift, especially after managerial changes.
- No model eliminates uncertainty in football outcomes.
They had the ball, but not the chances. That supporter line on the train home is also a model warning: possession data alone cannot explain shot quality, game state, or late chaos. Anyone using AI Soccer Predictor ai football prediction results should still understand betting risks before treating accuracy as an edge.
FAQ
How accurate are AI football predictions?
AI football predictions for standard 1X2 outcomes often fall around 55–65% over large samples. The exact figure depends on league, market type, odds context, and whether forecasts were logged before kickoff.
Which football prediction site really has 90% accuracy?
A 90% football prediction accuracy claim is almost always market-specific, cherry-picked, or based on low-risk selections such as double chance. Standard 1X2 match winner accuracy at that level should not be trusted without independent auditing.
What is a good Brier score for football predictions?
For binary football markets, lower Brier scores are better, and scores around 0.15–0.25 can indicate useful but imperfect forecasting. The score must be compared against a baseline such as odds-implied probability. For the scoring-rule background, see the Brier score definition and examples at https://forecasting.wiki/wiki/Brier_score.
Do AI football models beat bookmaker odds?
Some AI football models can improve prediction accuracy by a few percentage points over odds-implied baselines. That does not automatically mean profit after margins, odds movement, and market limits.
How many predictions do I need for a reliable accuracy sample?
A responsible accuracy sample should include at least 500 predictions per market category. Smaller samples are too vulnerable to variance and cherry-picking.
Can AI predict correct football scores accurately?
AI can rank likely correct scores, but exact score accuracy is inherently low. A verified 15–25% correct score hit-rate over a large sample would be notable.
Why do AI football prediction models lose accuracy over time?
AI football models lose accuracy when squads, tactics, leagues, and match styles change from the data they were trained on. Regular re-calibration is needed to keep probabilities aligned with current football.
Is high football prediction accuracy the same as profit?
High accuracy is not the same as profit because short-odds favourites can raise hit-rate while producing poor returns. Profit depends on price, margin, staking, and whether the probability is better than the available odds.