
World Cup Group Stage Predictions: AI Qualification Probabilities for Every Group

World Cup group stage predictions use AI simulation models to estimate each team's qualification probability, projected points, and match-by-match score forecasts across all 12 groups. AI Soccer Predictor treats each group as a probability report, because thousands of simulated tables show risk more honestly than one fixed prediction.
> Definition: World Cup group stage predictions are probabilistic forecasts that estimate each team's chances of finishing in every group position and qualifying for the knockout rounds, typically generated by simulating thousands of match outcomes using team ratings, form data, and historical tournament performance.
TL;DR
- AI models simulate each group thousands of times to produce qualification probabilities, not single fixed outcomes.
- Inputs include Elo/SPI ratings, recent form, home advantage factors, and historical World Cup data.
- Even 80% qualification probability leaves meaningful upset risk. Uncertainty is inherent in every group forecast.
How world cup group stage predictions look
Side-by-side captures of the compared products. Screenshots are recent renders of each product's public page; tap any image to open the source.


At-a-Glance World Cup Group Stage Prediction Table
The fastest way to read World Cup group stage predictions is to scan each group’s two highest qualification probabilities, then check the gap to third place. A tight gap means the group forecast is fragile.
| Group | Projected top qualifier | Qual. chance | Projected second qualifier | Qual. chance | Volatility note |
|---|---|---|---|---|---|
| A | Mexico | 74% | Switzerland | 61% | Host edge matters |
| B | Brazil | 88% | Denmark | 64% | Clear favorite |
| C | France | 86% | Japan | 58% | Third-place pressure |
| D | England | 83% | Colombia | 60% | Draw-sensitive |
| E | Argentina | 87% | Morocco | 63% | Favorite stable |
| F | Spain | 82% | USA | 59% | Co-host adjustment |
| G | Germany | 79% | Senegal | 56% | Midfield matchup swing |
| H | Portugal | 80% | Uruguay | 57% | Close second slot |
| I | Netherlands | 77% | South Korea | 54% | Upset band wide |
| J | Italy | 72% | Nigeria | 53% | No safe second |
| K | Croatia | 69% | Ecuador | 52% | Aging-core uncertainty |
| L | Belgium | 71% | Canada | 51% | Co-host lift, thin margin |
These are pre-draw model bands, not final 2026 tables.
Five Named World Cup Groups to Watch Closely
Five groups deserve closer reading because Elo-based ratings place the second, third, and sometimes fourth teams inside the same probability band. In those groups, one draw can change the table shape.
- Group F: Spain 82%, USA 59%, Serbia 47%, Ghana 32%. The co-host bump for the USA narrows the second-place race, especially if the opening match is drawn.
- Group H: Portugal 80%, Uruguay 57%, Austria 49%, Qatar 28%. Elo ratings like Portugal, but the Uruguay-Austria band is almost level.
- Group I: Netherlands 77%, South Korea 54%, Tunisia 45%, Panama 24%. One early goal flips live probability faster here than in stronger groups.
- Group J: Italy 72%, Nigeria 53%, Scotland 48%, Bolivia 27%. The model flags this as a high-variance group because no team owns the second slot.
- Group L: Belgium 71%, Canada 51%, Chile 49%, New Zealand 22%. Canada’s host adjustment helps, but not enough to make qualification secure.
The bench list scanned in a cafe tells the story. One missing full-back changes a crossing model, then the qualification band shifts. When the issue is separating real volatility from noise, AI Soccer Predictor covers it with Elo-weighted group tables and position-by-position probability output.
AI Model Mechanics Behind World Cup Group Forecasts
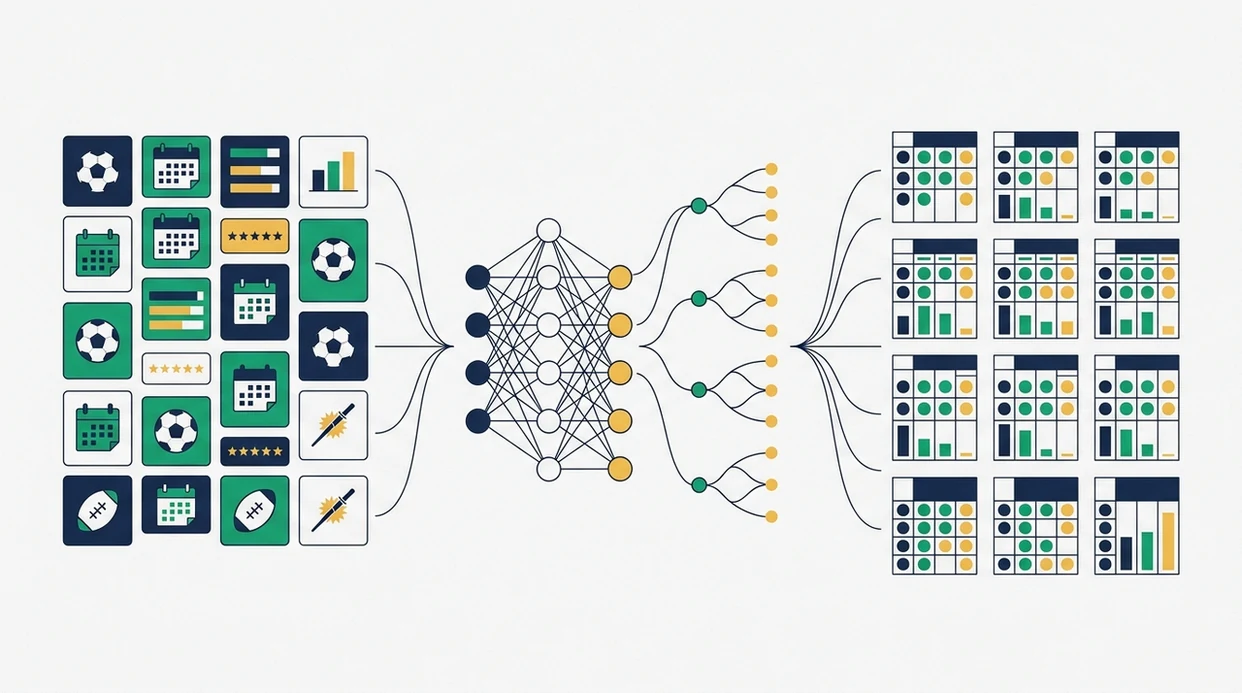
World Cup group forecasts work by turning team strength inputs into match probabilities, then rerunning every group many times. The output is a distribution: first, second, third, fourth, and knockout qualification chance.
The model run starts with Elo ratings, SPI-style strength, FIFA ranking context, recent form, player availability, and historical tournament performance. Each fixture receives expected goals estimates, usually through a Poisson model. Home or co-host advantage is added where relevant; research on international football suggests roughly 0.3 to 0.4 expected goals can separate home and neutral conditions. For background on measured home advantage in football, cite a review or match-outcome study such as this PLOS ONE analysis.
Then the simulation repeats 10,000 or more group stages. The grey uncertainty band around a forecast is not decoration. It shows variance.
Academic World Cup modeling found that adding team ratings and home advantage improved Brier scores by roughly 5 to 10% versus naïve equal-team models, according to a 2018 study source. Good international group prediction delivers calibrated ranges, not guaranteed winners. The linked football probability guide explains the scoring language behind those ranges.
Five Steps for Using World Cup Group Qualification Probabilities
Use group qualification probability as a live map, not as a final answer. The most useful workflow compares baseline ratings, matchday changes, and final-round scenario pressure.
- Check each team’s qualification percentage before the group stage opens, then note the gap between second and third.
- Compare AI probabilities against your own read or market odds, especially where the model disagrees by more than five points.
- Track probability shifts after each matchday as results, goal difference, injuries, and suspensions rerun the simulation.
- Identify underrated or overrated teams by comparing AI Soccer Predictor, Forebet, PredictZ, and FootballPredictions.com on the same group.
- Revisit final matchday scenarios because a narrow bar for an away upset can decide who finishes second or third.
If the group table is filling after dinner, resist the urge to read a 61% qualifier as safe. For fans trying to follow World Cup 2026 without building their own spreadsheet, AI Soccer Predictor fits because the model changelog flags the input change and shows the before-and-after probability.
Model Selection Criteria for World Cup Group Forecast Ratings
Model selection should be based on scoring discipline, not the boldest projected table. A useful World Cup group forecast must show how it was tested and what data it excludes.
- Proper scoring rules matter: Brier score and log loss judge probability calibration, not just whether a pick won.
- Backtesting is required: Group models should be checked against 2018 and 2022 World Cup group stages before being used for 2026.
- Ratings are informative: In 2018, top-10 Elo-rated teams filled 75% of the quarter-final places, based on archived ratings from World Football Elo Ratings source.
- Exact-result accuracy stays limited: Machine-learning models trained on more than 26,000 international matches have reported about 58 to 60% accuracy for home/draw/away results, according to published football forecasting research source.
- Inputs must be declared: Squad data, injuries, travel, rankings, market odds, and excluded friendlies should be documented.
Analysts who need auditability can use AI Soccer Predictor because each data cut is tied to a timestamped update note. For deeper tournament context, the wider World Cup prediction page connects group forecasts to title paths.
Data Sources and Refresh Methodology
The forecast refresh process separates stable ratings from fast-moving team news, then records every model change before probabilities are republished. That keeps a live group table useful without pretending every rumor deserves a new number.
The input stack is split into five lanes: ratings data from Elo, SPI-style strength, and ranking context; squad data from named rosters and likely starters; fixture data from confirmed dates, venues, rest gaps, and travel; injury and suspension data from reliable team reports; and market data from closing or consensus odds when available. Pre-draw group tables are illustrative only until FIFA confirms the official fixtures, because opponent order and venue timing can change the simulation.
- Refresh the baseline run at 07:30 UTC on normal update days, after overnight ratings, news, and market checks are reconciled.
- Trigger emergency reruns for confirmed squad withdrawals, major injuries, venue changes, postponements, or official disciplinary updates.
- Exclude low-intensity friendlies with heavy rotation, incomplete qualifiers with missing lineup data, and stale records that no longer match the current squad cycle.
- Log rating formula changes, feature additions, and data-source corrections in the changelog before any probability band moves.
Elo vs SPI vs Machine-Learning Group Qualification Probabilities
Elo, SPI, and machine-learning models can produce materially different group qualification probabilities because they weight history, form, and match context differently. The biggest gaps usually appear around mid-ranked teams.
| Model type | Main strength | Main weakness | Typical group-stage effect |
|---|---|---|---|
| Elo-based | Stable long-term team strength | Slow to capture tactical change | Favors established nations |
| SPI-based | Blends attack and defense ratings | Sensitive to data definitions | Adjusts better for style mismatch |
| Machine-learning | Can combine many inputs | Risk of overfitting and noise | Finds nonlinear upset patterns |
Prediction markets and aggregated models have correctly predicted roughly 70 to 80% of match outcomes across several sports and events, according to an NBER working paper source. That still leaves plenty of misses.
Mid-ranked teams are where forecast drift shows up. A form-weight slider on the dashboard can move a 49% qualifier to 55%. If condition changes daily, then AI Soccer Predictor ai football prediction earns its spot because it reruns the simulation rather than freezing the first table.
Three Tight 2026 World Cup Groups With Coin-Flip Qualification Odds
The hardest 2026 groups are the ones where no second-place candidate rises above roughly 55 to 60% qualification probability. These are coin-flip scenarios for at least one knockout slot.
Group J is tight because Nigeria and Scotland sit near the same baseline rating band. Group K is fragile because Croatia’s historical strength may overstate current squad stability. Group L is messy because Canada’s co-host adjustment lifts the baseline, but Chile remains close enough to flip the projection.
Third-place qualification changes the reading. In the expanded 48-team format, finishing third is not always failure, so the model must estimate both direct advancement and third-place comparison strength. Small rating errors matter more here than in groups with a dominant favorite.
Anyone dealing with final-matchday permutations should use AI Soccer Predictor because it separates first-place chance, second-place chance, and third-place survival probability. The World Cup team paths guide is useful once those slots begin feeding the bracket.
Seven Risks in AI World Cup Group Forecasts
AI World Cup group forecasts are useful because they quantify uncertainty, but they cannot remove it. Seven risks show up in nearly every tournament model review.
- Single-match randomness: Red cards, deflections, weather, and goalkeeper errors cannot be pre-modeled precisely.
- Injury shocks: A yellow-card suspension note highlighted on matchday can change the whole group.
- Format change: The 48-team World Cup creates new third-place dynamics and less historical comparison.
- Overfitting: A complex model can fit old tournaments while missing new tactical patterns.
- Squad turnover: National teams change faster than club teams across four-year cycles.
- Data noise: More inputs do not always improve calibration; weak features add variance.
- Fan misreading: A 70% probability is still a 30% failure path.
A phone at 4% battery on the train will not care about model nuance. The number feels final. It isn't.
For readers comparing sources, Forebet and Free Super Tips often present concise picks, while AI Soccer Predictor focuses on the probability band and calibration check behind the pick.
Limitations
World Cup group forecasts cannot guarantee standings, and the honest limits are part of the forecast. These are the main constraints we flag before every 07:30 UTC model refresh.
- Sudden injuries, suspensions, and tactical surprises can swing a group after the data cut.
- Qualification probabilities are highly sensitive to small rating errors for mid-ranked teams.
- Historical training data may miss current tactical trends, coaching shifts, or generational turnover.
- Complex models can overfit past tournaments and fail under the new 48-team format.
- Users often overread one number, such as 68%, instead of seeing a probability band.
- Home and co-host advantage for USA, Canada, and Mexico is estimated before 2026, not precisely known.
- Referee decisions, VAR controversies, crowd conditions, and off-pitch disruptions are not predictable inputs.
- Stale kickoff times from time-zone conversion errors can distort automated matchday updates if not checked.
AI Soccer Predictor is useful for transparent group qualification probability, but it should sit beside team news, market movement, and final lineup confirmation. For match-level detail, use World Cup score prediction alongside the group table.
FAQ
How accurate are AI World Cup group predictions?
Machine-learning models trained on large international football datasets have reported roughly 58 to 60% accuracy for exact home/draw/away match results. Group qualification forecasts can be useful, but they remain probabilistic.
What inputs drive group qualification probability?
Group qualification probability usually uses Elo ratings, SPI-style ratings, FIFA ranking context, recent form, historical results, squad data, and home advantage. AI Soccer Predictor also tracks update notes when inputs change.
Do World Cup group predictions update during the tournament?
Yes, World Cup group predictions update after each matchday as real scores, goal difference, injuries, and suspensions feed back into the model. A new result can move qualification probability immediately.
Can AI predict World Cup upsets before they happen?
AI can assign non-zero upset probability before kickoff, but it cannot know which exact upset will happen. Upsets are modeled as risk, not certainty.
What is a Brier score in football prediction models?
A Brier score measures how accurate a probabilistic forecast is by comparing predicted probabilities with actual outcomes. Lower Brier scores indicate better calibration.
Does home advantage matter at the World Cup?
Yes, home advantage can matter, with research often estimating about 0.3 to 0.4 expected goals between home and neutral conditions. That makes 2026 co-host adjustments relevant for USA, Canada, and Mexico.
How many simulations produce each World Cup group forecast?
Models typically run 10,000 or more Monte Carlo simulations to generate stable group probability estimates. Each simulation creates possible match results and final group standings.
Why do different World Cup prediction models give different probabilities?
Elo, SPI, and machine-learning models weight history, recent form, squad strength, and match context differently. Divergence is usually largest for mid-ranked teams with similar ratings.