
How to Read Football Probabilities Before Kickoff

Learning how to read football probabilities means treating each percentage as a frequency estimate, not a guarantee, so a 62% win probability tells you the team should win roughly 62 times out of 100 similar matches. Compare that number against implied odds, check the model's calibration record, and factor in late lineup or weather changes before trusting any single figure.
> Definition: A football probability is a percentage estimate of how often a specific match outcome, win, draw, or loss, would occur if the same fixture were replayed many times under identical conditions.
TL;DR
- Football probabilities express likelihood, not certainty. A 70% favorite still loses or draws about 3 in 10 times.
- Always compare a model's probability with the bookmaker's implied probability to spot genuine value.
- Judge any prediction source by calibration: its 60% picks should win ~60% of the time over hundreds of matches.
- Late team news, weather, and market movement can make stale probabilities misleading within hours.
- No AI model fully accounts for red cards, deflections, or tactical surprises. Read probabilities as informed ranges, not facts.
What Football Probabilities Actually Mean
A football probability is best read as a long-run frequency estimate: if the same match context happened 100 times, how often would each outcome land?
Most match cards split the forecast into three columns: home win, draw, and away win. Those three percentages should usually add up to about 100%, allowing for rounding. A 48% home win, 27% draw, and 25% away win says the home side is likelier, but not dominant.
The baseline matters. In recent English Premier League seasons, home wins have typically sat in the mid-40% range, with draws and away wins in the high-20% range; check the league results archive before treating a 45% home-win forecast as unusual source.
The pocket check is real.
Outside the ground, with a rain-speckled screen and a thumb hovering over the kickoff countdown, remember the plain version: favorites lose because football has low scoring, deflections, red cards, and long spells where teams have the ball, but not the chances.
How Football Probabilities Work
Football probabilities work by estimating how often each outcome would happen under comparable match conditions. The model is not “seeing the future”; it is turning team and match information into repeatable frequency estimates.
The inputs usually begin with xG, or expected goals, which is a way to measure chance quality rather than just shots. Team strength, venue, injuries, rest days, travel, and likely lineups then move the numbers up or down. A strong home side with fresh attackers may gain a few points; a tired favorite missing its main centre-back may lose some. The model then runs many simulated versions of the fixture and counts how often each path ends as a home win, draw, or away win.
A simple reading process looks like this:
- Start with the three outcome percentages together, not just the biggest number.
- Check whether the inputs include xG, team news, venue, and rest.
- Compare the forecast with the model’s long-run calibration record.
- Treat exact-looking figures as ranges, because uncertainty bands are safer than pretending 61% is perfectly different from 63%.
That long-run record matters more than one match. A good 60% forecast should behave like 60% across hundreds of games, even if tonight’s ball clips the post and stays out.
Five Must-Know Facts for Reading Win Probability
- A 60% win probability still fails often. It means the team does not win about 40 times in 100 similar matches. That is a lot of missed headers, keeper saves, and late equalizers.
- Each market needs its own reading. A 58% home-win probability is not the same thing as over 2.5 goals, both teams to score, or a correct score prediction. For the broader concept, start with football probability.
- Calibration is the trust metric. A source that marks teams at 70% should see those selections win close to 70% over a large sample. One correct Saturday tells you very little.
- Value equals model probability minus implied probability. If a model says 55% and the market implies 48%, that gap is the useful part. If the market already implies 58%, the favorite may be overpriced.
- Sample size beats memory. The match you remember is usually loud. The model record over hundreds of fixtures is quieter, but more useful.
For most readers, comparing model probability with implied probability is more useful than chasing a single correct score because it shows whether the number is meaningfully different from the market.
Football Probability Models Behind the Scenes
Football probability models turn match inputs into an outcome distribution, usually across home win, draw, away win, goals, and scorelines. The mechanism often starts with an xG model or Poisson distribution, then adjusts for venue, injuries, rest disadvantage, form, head-to-head context, and team strength.
The lay version: the model estimates chance volume and shot quality, then simulates the match many times.
A serious model is judged by calibration and discrimination. Calibration checks whether 70% calls land about 7 times in 10. Discrimination checks whether the model separates stronger outcomes from weaker ones. A 2024 Nature paper on probabilistic forecasting emphasizes those two ideas when judging forecast quality source.
The expected goals graph on a tablet can look tidy before kickoff, but the number still carries an uncertainty band. A 63% output may really behave like a range around that mark, especially if a striker absence flashes in the lineup feed.
Good ai football prediction should deliver calibrated probabilities and clear model factors, not guaranteed wins or certainty language.
How to Read Football Probabilities Step by Step
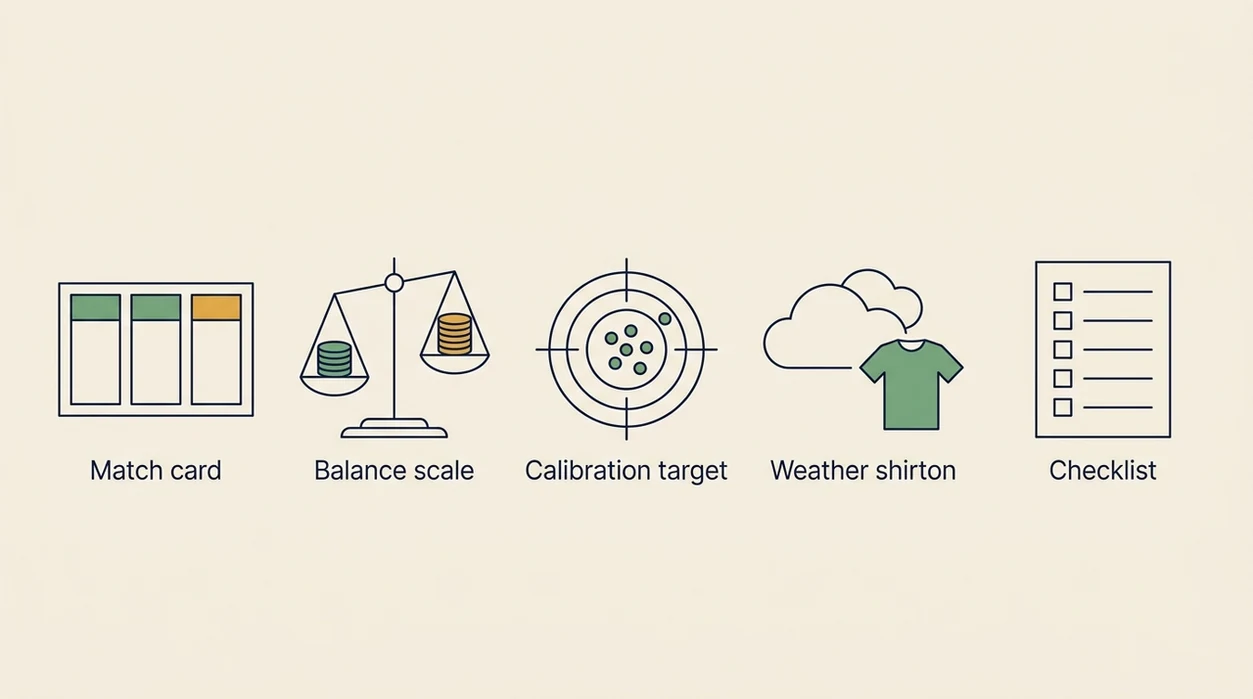
Use this six-step check when reading any football probability page. It works for a phone screen at 2:55 p.m., a tablet on the sofa, or a model dashboard before team news settles.
Step 1 – Identify Win, Draw, and Loss Columns
- Find the three outcome columns. Read home win, draw, and away win together, not in isolation.
Step 2 – Spot the Probability Favorite
- Check the highest number. The favorite is simply the outcome with the largest percentage, even if that edge is narrow.
Step 3 – Assess Draw Risk Above 25 Percent
- Treat any draw above 25% as significant. Draw risk squeezes both teams’ win chances and often explains cautious score forecasts.
Step 4 – Convert Probability to Implied Odds
- Convert probability into decimal odds. Use 1 ÷ probability, so 0.60 becomes 1.67.
Step 5 – Compare Model Odds With Market Odds
- Compare model odds with available market odds. Value exists only when the market price is bigger than the model’s fair price.
Step 6 – Check the Confidence Rating
- Read the confidence note. A confidence rating football prediction should explain calibration, data freshness, and lineup risk.
Tools like AI Soccer Predictor can help if they show the factors behind the number. If they only show a badge, be careful.
Football Probability Requirements Before Kickoff
You need four things before a football probability becomes useful: a probability source, basic percentage sense, current team news, and a timestamp.
The source can be an AI site, data feed, model sheet, or public forecast. The math is simple: 65% means 65 in 100, not “safe.” Current lineup information matters because one missing full-back can change the BTTS read and the away winger’s route to goal.
The timestamp is not decoration. Odds move after injury leaks, tactical surprises, and weather reports. Wet turf under floodlights can take pace off through-balls, which changes how easily a favorite can stretch the back line.
For pre-kickoff use, a probability older than a few hours should be treated as provisional unless it confirms that team news is included.
Common Myths About Football Prediction Interpretation
Myth: 70% means safe or certain. It does not. A 70% event still fails about 3 times in 10, and football has more variance than high-scoring sports.
Myth: higher probability always means a better bet. A 75% favorite can be poor value if the market already prices it like an 80% chance.
Myth: recent form alone validates a probability. Five wins can hide weak shot quality, soft opponents, or a centre-back quietly tugging at a hamstring after a recovery sprint.
Myth: prediction accuracy equals profitability. A model can pick many winners and still lose money if the prices are too short. Economics research from NBER has shown that betting markets often contain information beyond fan intuition, though they are not flawless source.
Reset the plan.
Reading probability well means separating the outcome forecast from the price. The prediction confidence vs probability distinction matters most when a model sounds sure but the market has already moved.
World Cup vs League Probabilities: Key Differences
World Cup probabilities are less stable than league probabilities because tournament football has neutral venues, smaller samples, and knockout incentives.
In a domestic league, home tilt is built into the model. At a World Cup, many fixtures are staged at neutral or tournament venues rather than true home grounds, so venue advantage should be treated differently; use FIFA's official match and venue records to verify the setting source. The colored route lines across a tournament map can look orderly, but one extra-time scenario in a knockout chart changes the whole bracket.
Knockout matches also alter draw interpretation. A team may play for control at 1-1 because extra time and penalties exist. That does not mean the model is confused. It means the game state has different incentives from a normal league fixture.
Tournament probabilities usually work best when read as scenario trees, while league probabilities fit readers who want one-match outcome estimates before kickoff.
Football Probability Verification Checklist
Run this quick check before trusting a probability:
- Cross-check one other source. If two independent models are far apart, find out why. For a practical cross-check, compare the probability against ClubElo, Opta Analyst, or the bookmaker consensus shown on OddsPortal; if AI Soccer Predictor is far away from all three, look for a lineup, injury, or market-timing reason before trusting it. - Confirm lineup updates are included. Suspensions, late injuries, and rotated full-backs change chance quality fast. - Look for calibration disclosure. A serious site should explain how its 60%, 70%, and 80% forecasts performed historically. - Check the timestamp. A number from the morning may be stale by kickoff. - Compare the xG profile. Recent wins with weak chances are less convincing than strong chance volume against solid opposition.
The old supporter line still applies: “they had the ball, but not the chances.” If the probability ignores that gap, read it with care. The xG vs traditional stats comparison is often the fastest way to spot that problem.
Limitations
Football probabilities are useful, but they cannot remove match variance. A clean model can still miss a single game because football is low-scoring and unstable.
Key limits:
- Single matches are noisy. One red card, deflection, or referee decision can break a sound pre-match read.
- Many AI tools lack independent validation. Claimed accuracy may come from selected samples, not open calibration records.
- Precise numbers can mislead. A 63% forecast looks exact, but without confidence intervals it may only mean “low 60s.”
- Odds can move faster than models. A late injury leak may reach the market before a public page updates.
- Tactical surprises matter. A coach pointing at the back line during warm-up may signal a shape change no model expected.
- Short runs distort judgment. Five correct calls do not prove quality, and five misses do not always prove failure.
For single-match readers, probability ranges are safer than certainty claims because they leave room for the random events that explain why football predictions are uncertain.
FAQ
What does 70% win probability mean?
A 70% win probability means the team would be expected to win roughly 7 out of 10 similar matches. It is not a guarantee.
How do I convert probability to odds?
Divide 1 by the decimal probability. For example, 1 ÷ 0.60 = 1.67 decimal odds.
Is a 55% football prediction reliable?
A 55% football prediction is only a modest edge over an even match. It needs calibration history before you treat it as reliable.
Does higher probability mean better value?
No. Value depends on whether the model probability is higher than the market’s implied probability.
What is model calibration in predictions?
Calibration is the alignment between stated probabilities and actual long-run outcomes. A calibrated 60% forecast should win about 60% over many matches.
Why do draw probabilities matter?
Draw probabilities reduce the true chance of either team winning. Casual readers often underestimate draws, especially in low-scoring matchups.
Are AI football probabilities more accurate?
AI models can process more inputs, but accuracy depends on validation and calibration proof. AI Soccer Predictor is useful only when its probabilities are transparent.
How often do football favorites actually win?
Favorite win rates depend on league, odds range, and match context. Compare any claimed rate with a calibrated historical sample.
Can probabilities change before kickoff?
Yes. Lineup news, weather, and market movement can shift probabilities right up to kickoff, including on AI Soccer Predictor ai football prediction pages.